Are women becoming more competitive in national elections in Papua New Guinea? The obvious answer would seem to be no. In 2012 three women were elected; in 2017 none were. But looking at winners alone hides as much as it reveals. Even if women aren’t winning elections, the average woman might still be becoming more competitive.
If true, this wouldn’t change the fact that women face many political obstacles, but it would at least suggest some small-scale improvements were afoot. It might also suggest that aid donors, who have funded various attempts at assisting female candidates, were becoming more effective.
This week we released the latest iteration of the Papua New Guinea Election Results Database. The dataset contains results from national general elections in PNG spanning back to the 1970s. The latest iteration covers the 2017 general elections. It also affords the first ever opportunity to look at trends in female candidate competitiveness. This shouldn’t be the first ever opportunity, but comprehensive data on candidate gender don’t exist before 2007. And, unfortunately, most detailed results from the 2007 election were lost. And so, 2012 and 2017 offer our first ever chance to compare female candidate competitiveness over time. The time period is short – two elections – but it is a start. In our new discussion paper on the 2017 election in PNG, Maholopa Laveil and I compared the competitiveness of women candidates across the last two elections.
We started by looking at female competitiveness on first preference votes. The measure we used for this was the number of first preference votes won by each woman candidate divided by the number of first preference votes won by the candidate in their electorate who was leading after first preferences had been counted. We used this measure because a candidate who wins 1000 votes in an electorate where the leader wins 1001 votes is much more competitive than a candidate who wins 1000 votes in an electorate where the leader wins 10,000. On this measure, a woman who was leading after first preferences were counted would score 1. A woman who won zero first preference votes would score 0.
The chart below shows histograms of female candidate competitiveness for 2012 and 2017. The percentage of women to the right of 0.5, in bars coloured green, who might be said to have been strongly competitive, became smaller between 2012 and 2017. That’s the bad news. On the other hand, the far left of the chart shows a slightly more positive tale. The percentage of women in the first bar (coloured red – who you can think of as very, very uncompetitive) fell from 63 to 57 per cent, while the share in the next two orange bars – each bar being progressively more competitive, increased. This hardly counts as transformative change. But it does show women were less prevalent in the absolute bottom tier of candidates in 2017 than in 2012.
Histograms of female first preference competitiveness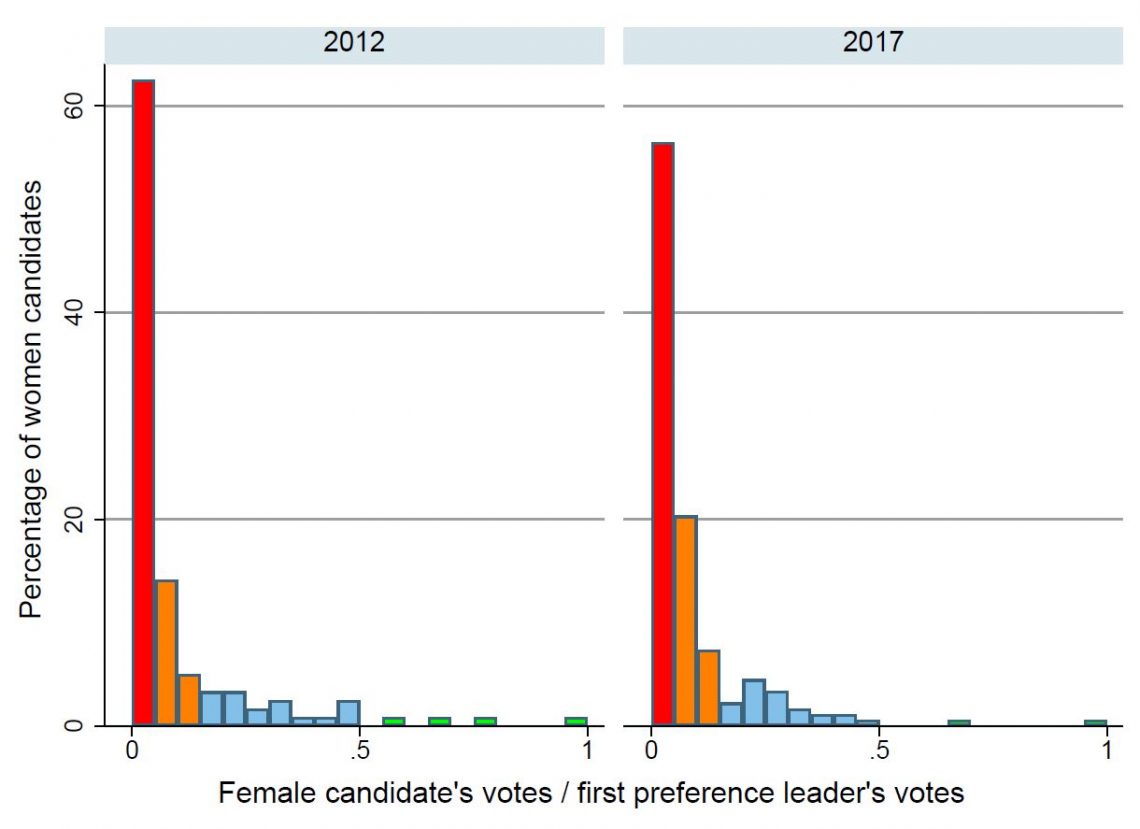
That’s before preference reallocation, what about after? We know from headline results that one woman, Delilah Gore, fell from first place as second and third preference votes were reallocated, but was her experience representative? The short answer is no. I’ve written before that preference reallocation tends to favour female candidates, and this was true again in 2017 (see page 38 of the report). What’s more, the average after-preference standing of women candidates improved discernibly between 2012 and 2017.
We studied this by creating an after-preference competitiveness measure, which involved dividing each female candidate’s final after-preference rank by the total number of candidates in their electorate. We did this because someone who comes second in a field of 20 candidates is probably more competitive than someone who comes second in a field of two. Our measure accounts for this. Somewhat confusingly, the best possible score on this measure is very low, close to zero. The worst possible score, for a woman who came last after preferences, is one. The table below compares the mean and median after-preference competitiveness scores for women between 2012 and 2017. Both fell, which reflects an improvement. (For both measures the improvement was large enough to be statistically significant at p<0.1.) On average, women candidates were more competitive after preferences in 2017 than they were in 2012.
Female candidate after-preference competitiveness

The improvement was not massive. And two elections is too short a period to allow any bold claims about long-term trends. The gains between 2012 and 2017 could be reversed in 2022.
Nevertheless, women candidates do appear to have become a bit more competitive between the last two elections in PNG. This is particularly true after preferences.
Women candidates still face too many challenges in electoral competition in PNG. And there is still a desperate need for reserved women’s seats. But small gains may be occurring. Importantly, the average performance of all the women who stood in 2017 tells a more positive story than the one that emerges if we look at winners alone.
Read the full discussion paper here.