Earlier this month my blog post highlighted that aid to the Pacific had boomed over the last decade and is now at record levels. This post looks at the impact on the Pacific by analysing changes in aid as a percentage of GNI and on a per capita basis. The first is a measure of aid dependency, and the second an indicator of the impact of aid on the population.
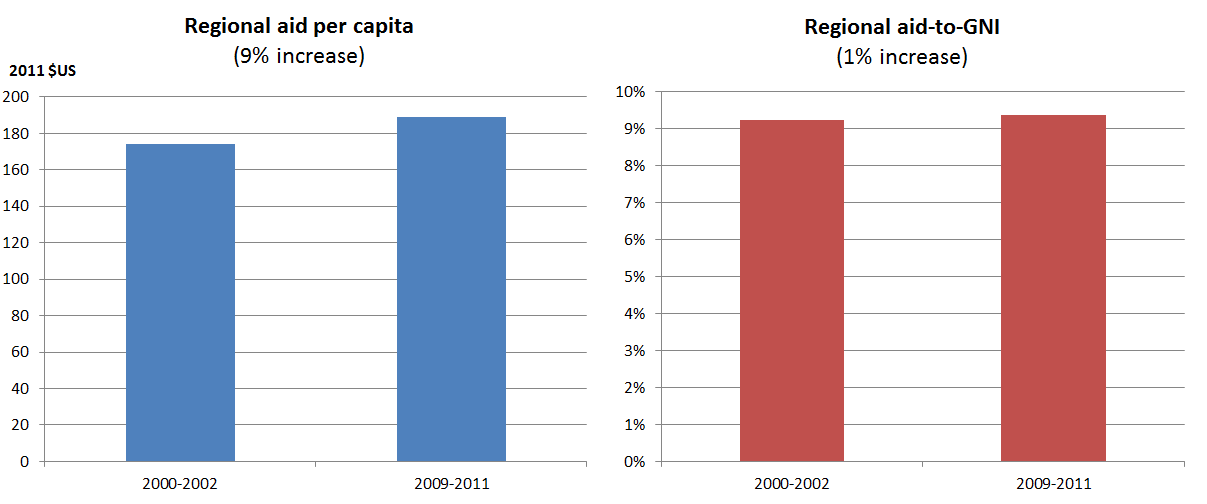
As the first graph below shows, for the Pacific as a whole, neither aid per capita nor aid-to-GNI has increased by much over the last decade. Aid per capita (adjusted for inflation) has gone up, but by less than 10%. And the aid/GNI ratio has barely shifted at all. However, these aggregates hide significant regional variation as I show below.
 Source: World Bank Databank
Aid per capita
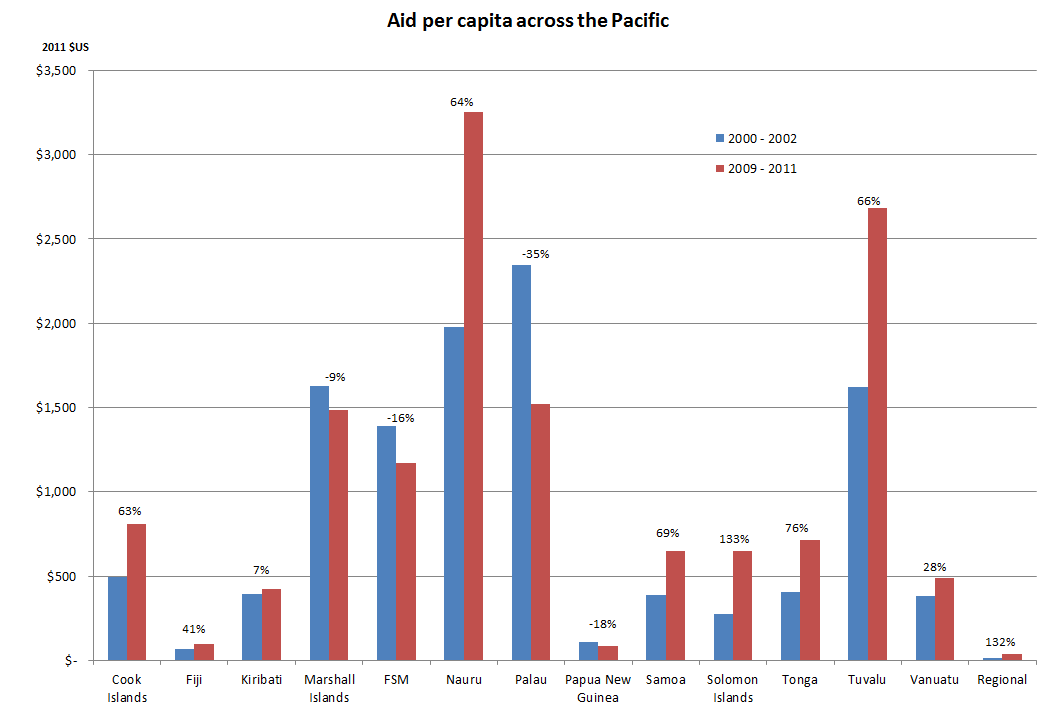
The graph below tracks aid per capita across the Pacific over the last decade. As per my last post, all Pacific Island Forum aid-recipient member countries are shown, except for Niue.
 Source: World Bank Databank. Populations for Cook Islands, Nauru and Niue are calculated from the Pacific 2020 report.
Note: The percentages indicate the growth of aid per capita between the two periods. An average three year period is taken to smooth out year to year volatility.
Niue is excluded from the graph because of scaling requirements. In 2000-2002 it received $4,842 in aid per capita. In 2009-2011, as its aid increased and its population declined, its aid per capita shot up to $11,280 (a 133% increase).
Work sheet for all graphs available here.
Most countries have experienced significant rises in aid per capita but by no means all. The US compact states of Micronesia (Marshall Islands, Palau and Federated States of Micronesia [FSM]) have seen significant declines, and so has PNG, the region’s biggest aid recipient by far.
In all cases except Niue (which actually has a declining population) population growth has meant that aid per capita has grown more slowly than total aid. In PNG, for example, aid over the last decade (in inflation adjusted terms) actually increased by 3%, but aid per capita actually decreased by 18%.
The distribution of per capita aid is very different to that of total aid. The largest recipients of aid in the region – PNG, Solomon Islands, FSM, Samoa, Vanuatu and Fiji – all come out receiving less per person than the micro-states of Nauru, Tuvalu and Niue. Cook Islands, though also tiny, seems to receive much less aid than the other micro states.
Kiribati also stands out. Tonga and Kiribati are countries that started the decade with very similar population and per capita income. A decade ago they were also getting about the same amount of aid. But Tonga’s per capita aid has almost doubled whereas Kiribati’s has hardly increased.
Aid dependency
Trends in aid dependency are shown below. Note that we lack time-series GNI data for Cook Islands, Nauru and Niue. The trends are similar to those for aid per capita. Aid dependency has fallen in the US compact states and PNG and has risen everywhere else.
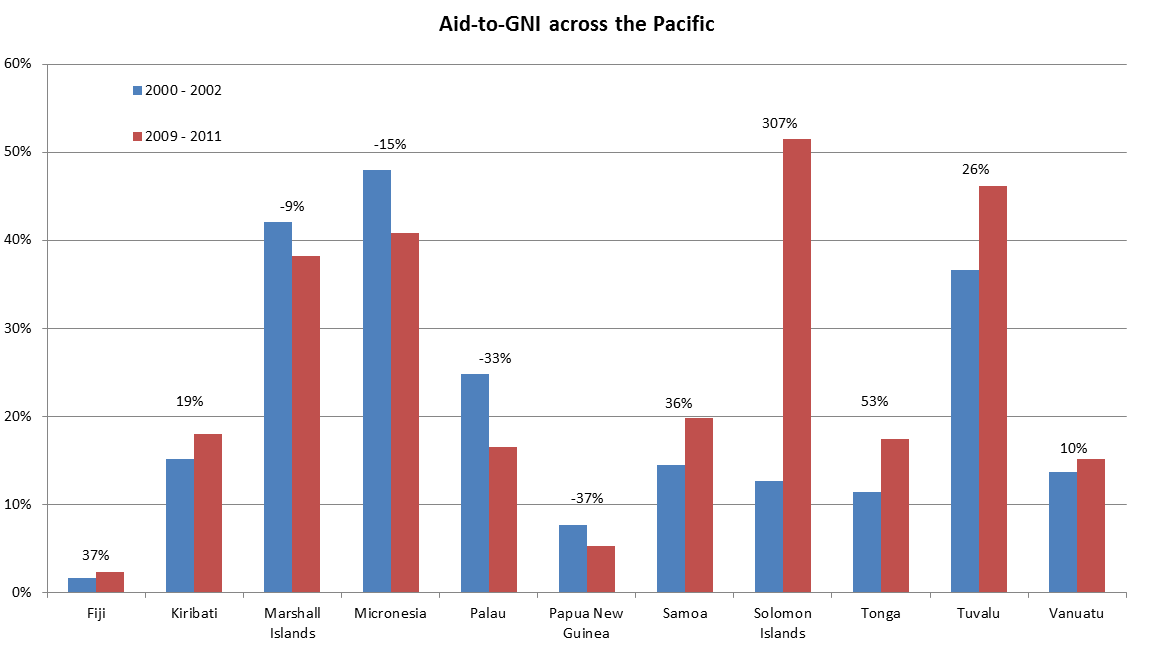 Note: The percentages indicate the growth of the aid to GNI ratios between the two periods. An average three year period is taken to smooth out year to year volatility. Cook Islands, Nauru and Niue have been excluded from this analysis due to a lack of GNI data.
On average, a low-income economy has an aid to GNI ratio of about 10%. In the Pacific nine out of the eleven countries sit above that line. In fact, eight Pacific countries are now among the top 20 most aid dependent nations in the world, with Vanuatu ranking not far behind at 23rd.
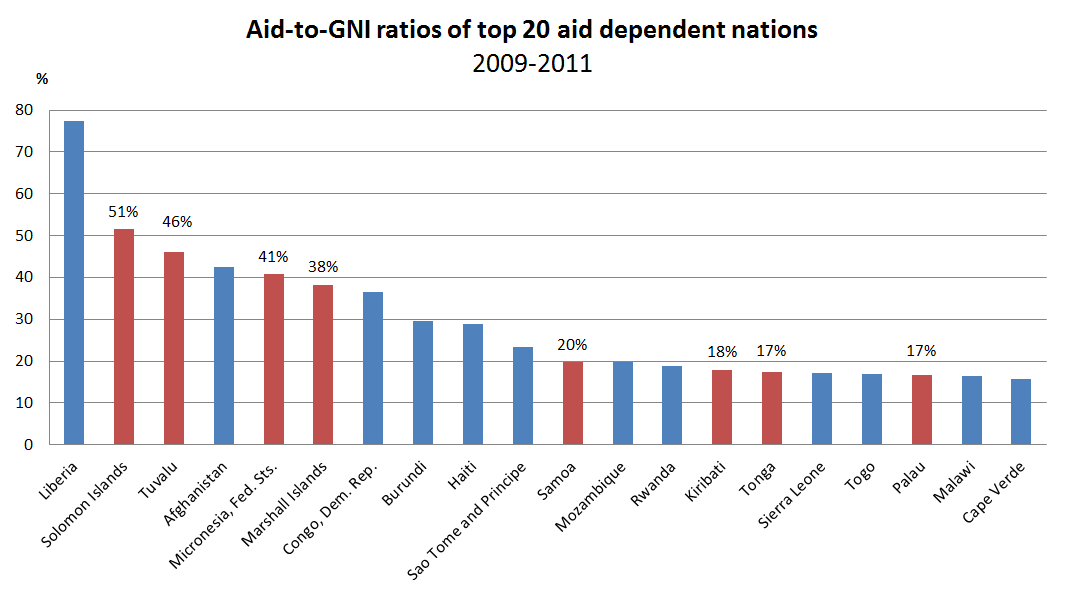 As the next and final graph shows, a decade ago only four Pacific states made it into the top 20 list. In the 2000-2002 period Kiribati ranked 23rd, Samoa ranked 25th, Vanuatu ranked 27th, Solomon Islands ranked 35th, and Tonga ranked 40th. Now four of these five are also in the top 20, joining Tuvalu and the three US compact states. The leap of the Solomon Islands from 35th to 2nd in terms of aid dependency is particularly striking.
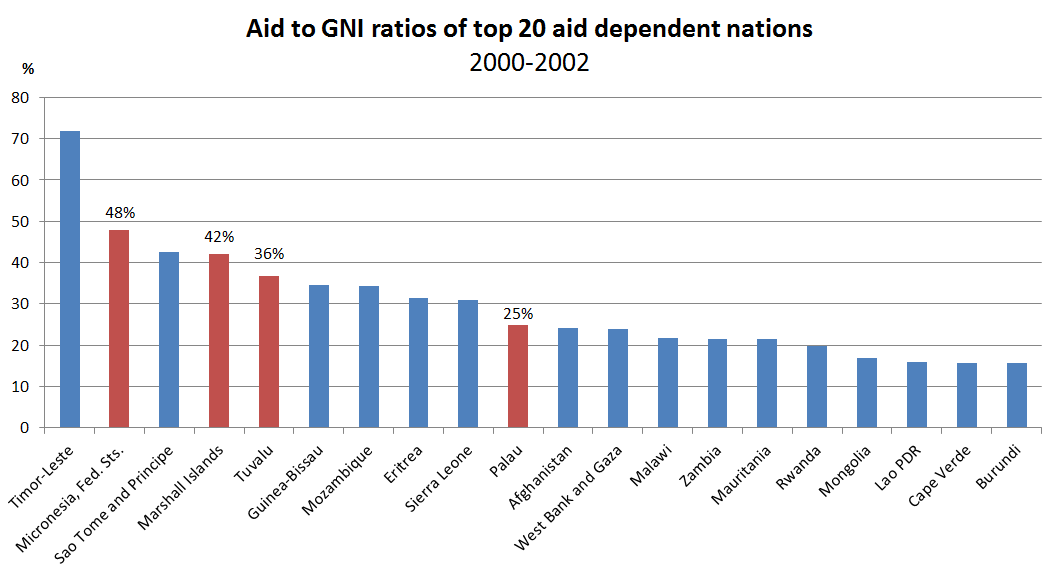 These numbers certainly endorse the starting point of the World Bank’s Pacific Futures brief that the Pacific is different from the rest of the world and should not be expected to follow a conventional growth path.
Is this increasing aid dependency in the Pacific a good or bad thing? Critics of aid would argue that it just confirms that aid has failed the Pacific. Others would argue that the Pacific will always be reliant on aid. The World Bank in its Pacific Futures Discussion Note has argued that “[g]eographic factors limit Pacific Island Countries’ capacity to follow the path taken by rapidly growing states.” And that “international assistance of various kinds is likely to remain an enduring feature of Pacific Island economies for the foreseeable future.” However well or poorly aid works in the Pacific, the graphs in this blog post seem to illustrate that point nicely.
Jonathan Pryke is a Research Officer at the Development Policy Centre.

I would not use the word “dependency”. If there was no aid it could be argued that there would be a corresponding decrease in the balance of trade. It is usually the hordes of foreign advisers who cause a large part of the trade imbalance. Nevertheless, your key point is correct. With the advent of “new development partners” especially from the asian sub continent there is more aid on offer now than ever before.
So this means that the new challenge is not about the size of aid per se but how strategically it is used. That may be why FA wants to be closer to AusAID.
Interesting articles, but as in all matters to do with Pacific statistics, proceed with some caution. A lot of this analysis hinges on the commonly promoted idea that what happens in the Forum Island countries is an adequate surrogate for describing the South Pacific as a whole. But which countries are left out? There are a number of “non-independent” countries in the region that receive a lot of “non-ODA” assistance. Recognising that Australia is by far the largest ODA donor in the Pacific probably needs to be balanced by a better appreciation that it is not just ODA that the Pacific has become dependent on. The total quantum of other forms of subsidy from France, the US and the EU into the region is also considerable. But the growth in South Pacific dependence on ODA is certainly worth commenting on, in its own right. As is the substantial decline in per capita aid to PNG over time.