
Growing candidate numbers in Papua New Guinea (PNG) have always intrigued me. I hail from a small island called Lou, roughly 20km southeast of the main Manus island. Manus is PNG’s smallest province. In the 2017 elections, it had 31,833 registered voters, of which only 3 percent were Lou Island voters. Each Lou voter can vote for two seats, the Provincial and the Open seat, and one would imagine that Lou would field a single candidate for each seat. Strangely, this wasn’t the case in 2017, when two Lou Island candidates contested the Manus Open seat, and three others contested the Provincial seat.
PNG has the highest candidate numbers per seat in the Pacific, and surely one of the highest in the world. The chart below shows average candidate numbers per electoral seat, for PNG, the Solomon Islands, and Samoa. Between 1977 and 2017, average candidate numbers increased by 275 percent in PNG, much more than the 60 percent increases in Solomon Islands, and the 0.8 percent decline in Samoa. In the same period, PNG’s population increased by 153 percent, suggesting other factors are driving the growth in candidate numbers.
Average candidate numbers per parliament seat: 1977 -2017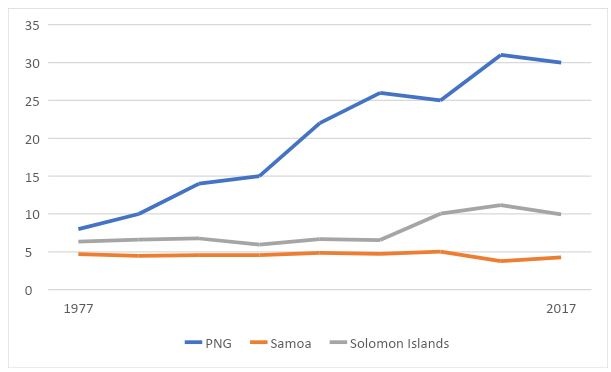
Growing candidate numbers are a concern for a number of reasons. They make elections more difficult to run, for instance by making the counting process longer. Pity the voters and administrators of the average electorate in PNG who have to decide a contest between 30 candidates. Now think of those in PNG’s most popular electorate, Chimbu province, which in 2017 had 61 contenders.
As a result of average numbers rising, average competitiveness has fallen. The chart below shows the average vote share of all candidates and of the winning candidate. Winner vote shares fell from a high of 35 percent in 1977, to 20 percent in 2002, before increasing again to average 33 percent from 2007 to 2017. This jump in 2007 resulted from the change in electoral systems from the first-past-the-post (FPTP) to Limited Preferential Voting (LPV) electoral systems in 2007, which allowed voters three preferences instead of one under the FPTP electoral system. The first preference count under the LPV replicates the FPTP counting process and the average winner vote share increased slightly to 22.5 percent in 2017, from 20 percent in in 2002. In 2017, 25 percent of candidates leading the first preference count went on to lose. The average vote share for all candidates continued to fall from 12 percent in 1977, reaching only 3 percent in 2017. (The median vote share is even lower.) Contesting the elections is increasingly becoming a wasted investment.
Average candidate and winner vote share in PNG: 1977 – 2017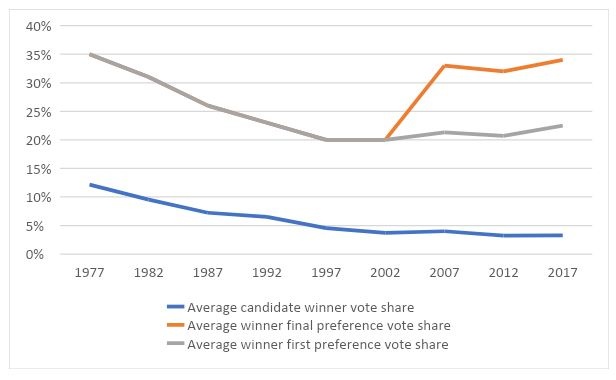
Within PNG, average candidate numbers vary across regions, but all have increased since 1977. Although the Highlands region had the highest average in the years after Independence, the Southern region took the lead in 1992, and continues to hold it. The Islands region has historically the lowest number of candidates contesting a seat.
The table below provides some details. Total candidate numbers have increased from 878 in 1977 to 3,335 in 2017, or a 280 percent increase in 40 years. Candidate numbers increased in all elections except the 2007 and 2017 elections, with the largest increases in the 1987 and 1997 elections.
PNG candidate and party statistics: 1977 – 2017
| Year | Seat numbers | Candidate numbers | Percent increase | Share of independents to total | Political parties | Political parties with candidates in more than half the seats |
| 1977 | 109 | 878 | No data | No data | No data | |
| 1982 | 109 | 1,124 | 28% | No data | No data | No data |
| 1987 | 109 | 1,515 | 35% | No data | No data | No data |
| 1992 | 109 | 1,644 | 9% | 74% | 20 | 2 |
| 1997 | 109 | 2,373 | 44% | 73% | 23 | 6 |
| 2002 | 109 | 2,875 | 21% | 43% | 44 | 13 |
| 2007 | 109 | 2,748 | -4% | No data | No data | No data |
| 2012 | 111 | 3,443 | 25% | 64% | 43 | 6 |
| 2017 | 111 | 3,335 | -3% | 57% | 43 | 9 |
One possible reason for growing candidate numbers in PNG raised in the literature is the increasing number of independents that contest every election. However, the table above shows no increase in the share of independents since 1992. Recent elections have in fact seen more candidates identify as members of a political party.
A growing number of political parties may explain some of the growth pre-2002. However, party numbers have remained largely stagnant since 2002, whereas candidate numbers have continued to rise. Another possibility might be a rise in powerful parties – parties that have been able to endorse candidates in more than half of the country’s seats. The number of such parties did rise rapidly between 1992 and 2002 and may have contributed to candidate growth during those years. However, parties of this sort have actually fallen in number since 2002.
Growing candidate numbers may also reflect increasing fragmentation within PNG societies, or perhaps a growing alignment of PNG’s electoral system with its underlying social realities. While there is no clear explanation, perhaps it is becoming the case that any aspiring leader needs to at least be an electoral candidate. It may be the case that it is better for any individual’s leadership prospects, political or otherwise, to run and lose than not to compete at all.
Whatever the reason, high candidate numbers in 2022 will only make already problematic elections (see here and here) even more difficult to administer.
Sources: PNG’s vote, candidate, and party data can be found on the PNG Elections Database; Samoa’s candidate data can be found on the Samoa Election Results Database; and Solomon Island’s candidate data can be found on the Solomon Islands Election Resources website. The author would like to thank Terence Wood for many great insights on PNG elections and politics.

Very true, although for all the anecdotal evidence we’ve encountered, it is still difficult to measure.
I have heard that some candidates stand with no intention of staying through to the end- aiming instead to be paid to stand down by other candidates. Other candidates stand to strategically split the vote of particular candidiates, to deliberately benefit their preferred candidate (sometimes their sponsor). So much political intrigue to untangle!
Strong and lucid piece, Maholopa. This helps frame PNG politics in very useful and instructive ways, especially around the intriguing questions of party formation and power. Thanks for this! Please keep publishing this kind of quality material. At some point I would be very interested to hear your reflections on possible implications of all this for 1. Policy processes, and 2. Pact or government formation processes (eg Alotau accord) 3. Patronage, which seems to be a crucial aspect in PNG politics.
On patronage, Terence Wood has done some good work on voter clientelism: https://onlinelibrary.wiley.com/doi/full/10.1002/app5.239
Pact or government formation process have been covered extensively by Michael Kabuni and Bal Kama:
https://www.researchgate.net/publication/327620367_Explaining_the_Paradox_of_Party_Instability_and_Political_Stability_in_Papua_New_Guinea_2012-2017
https://interactives.lowyinstitute.org/archive/png-in-2017/png-in-2017-png-political-condition-to-2025.html
On policy processes: the nomination fee is K1,000, still lower than the roughly K5,200 non-resource GDP per capita in 2017, which means that more people intending to run as candidates is possible. Former O’Neill government proposed an increase to K10,000 but failed to pass this amendment in Parliament. Perhaps the weakest part of candidate nomination requirements relates to having not committed a disciplinary/criminal offense in the past 9 months – any former crook with the means can contest the elections, increasing corruption levels. Also, reforms to the Organic Law on the Integrity of Political Parties and Candidates (OLIPPAC) in 2003 (imposing more stringent requirements on political party registration) seems to have kept party numbers steady at 43.